First, load the trivia_stats.R source file, which contains all functions for generating statistics:
source("trivia_stats.R")Joker Table
This chart takes into account both the creator’s average round difficulty and your own bias toward or against that creator to give you an overall sense of how much better than average you tend to do on rounds made by that creator, and therefore who you should pick to joker today.
Estimated Score Per Round = Average Score + Round Difficulty + Bias
joker_table_heatmap()Joker Scores Using Personal Judgement
This chart shows how many points a player does, on average, on their joker round than on the average round. It was meant to be read alongside the joker table above.
get_judgement_table()Percentage of Correct Jokers
This chart shows the percentage of time a player selects the correct round to joker, meaning the round they ultimately scored highest on.
correct_joker_plot()The post also tracks the percentage of nights where the winner would have changed if jokers had not been in play.
joker_win_percent()Ichigo and Chris Coefficients
These charts show how many points a player’s judgement score would increase or decrease if they had simply copied Ichigo’s or Chris’s joker round every week.
ichigo_coefficient_table()
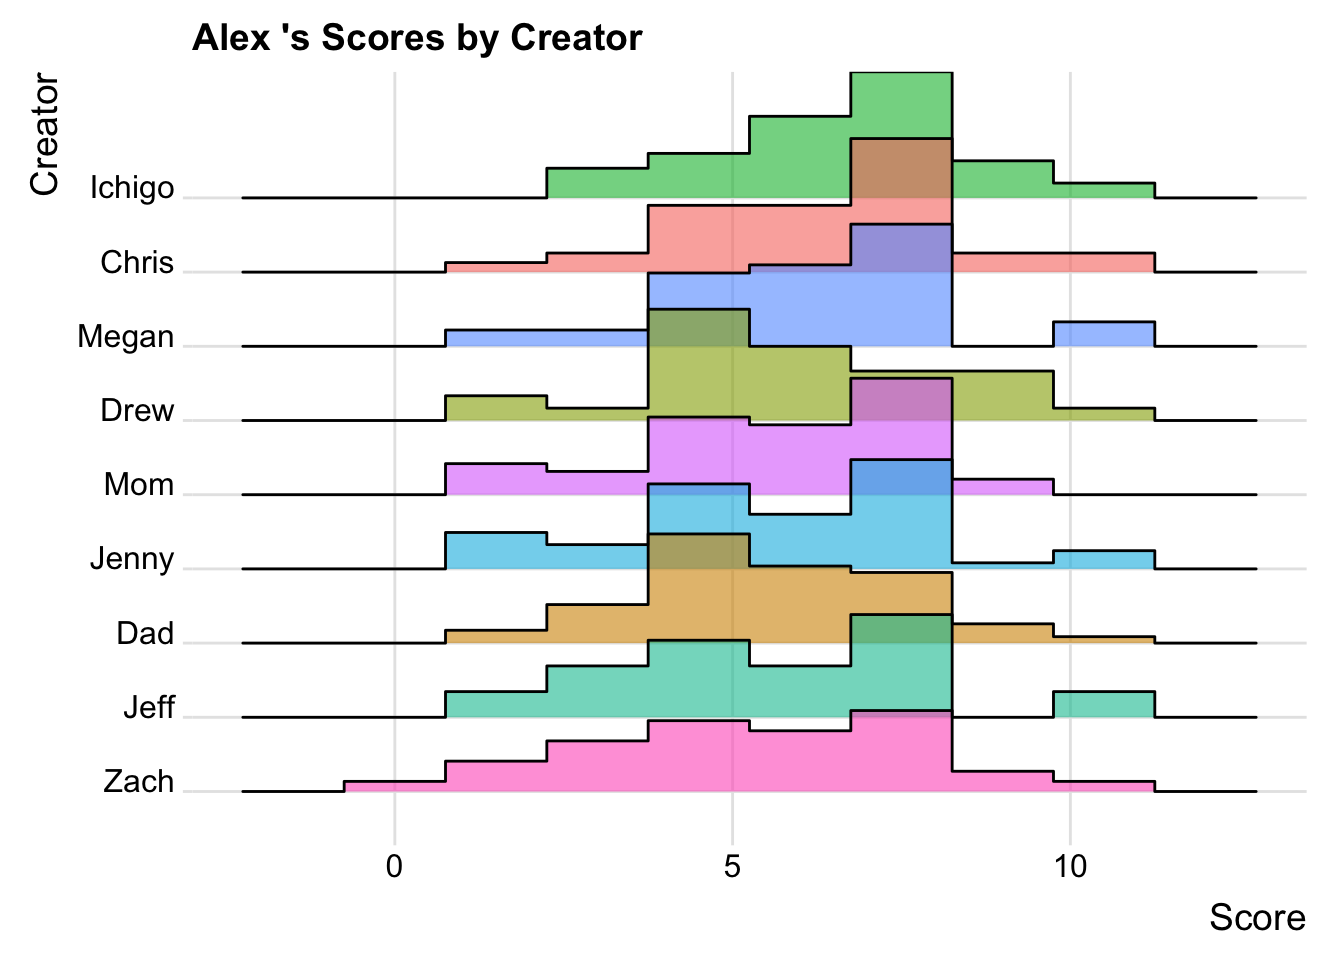
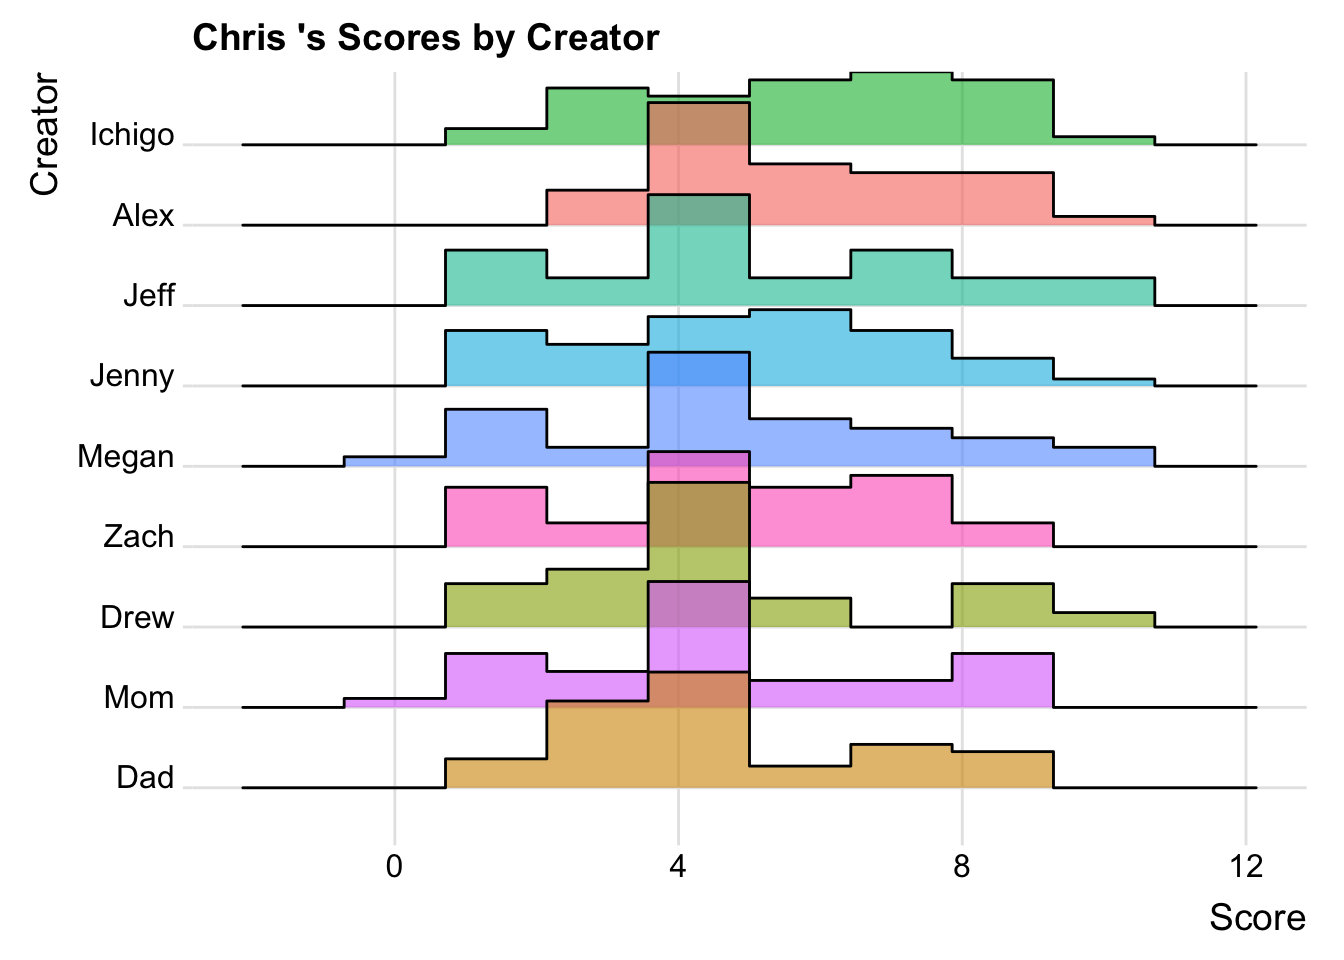
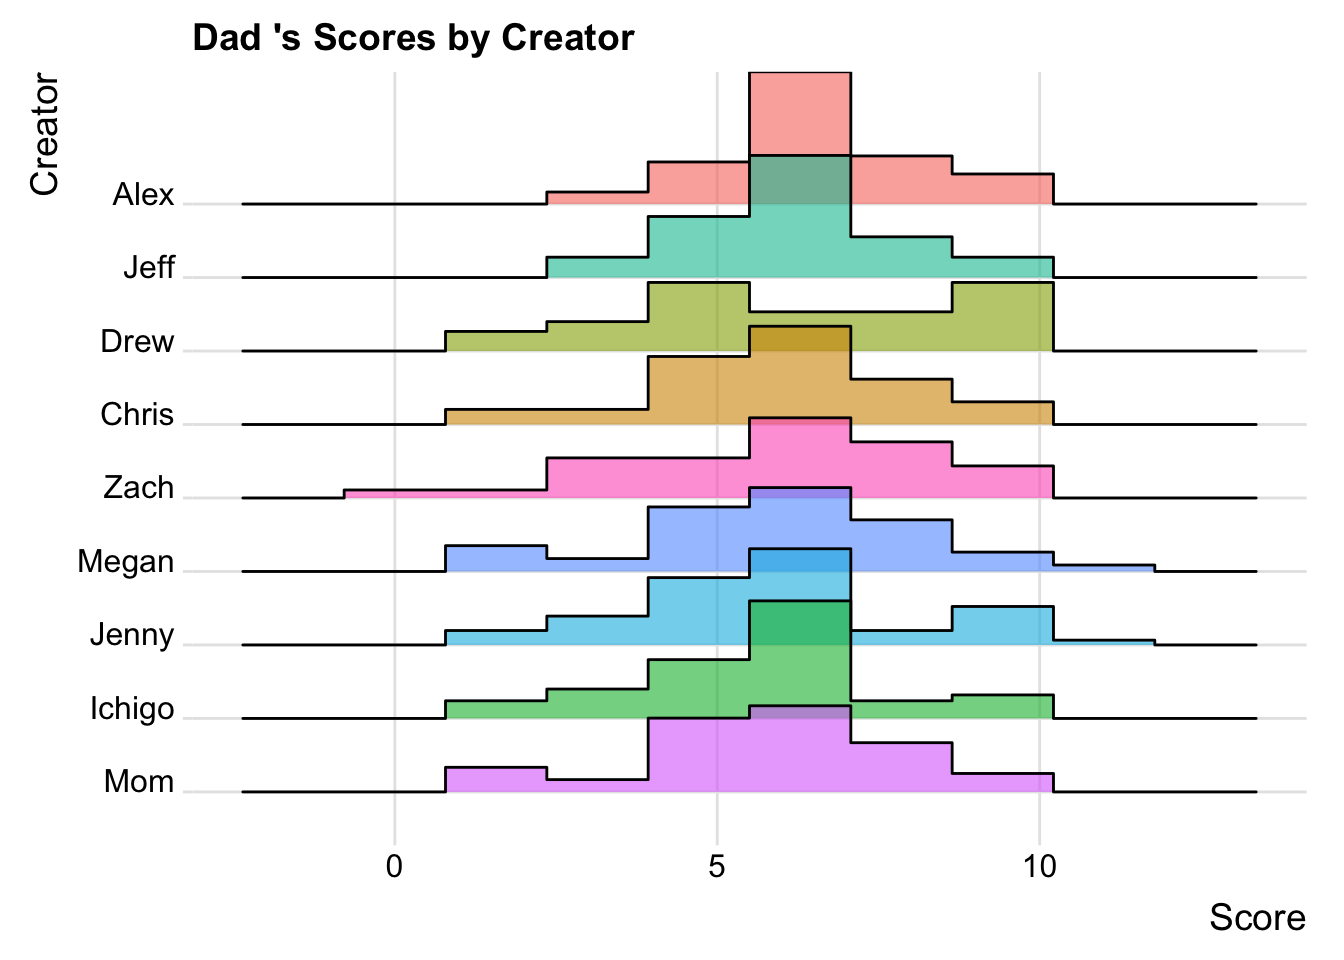
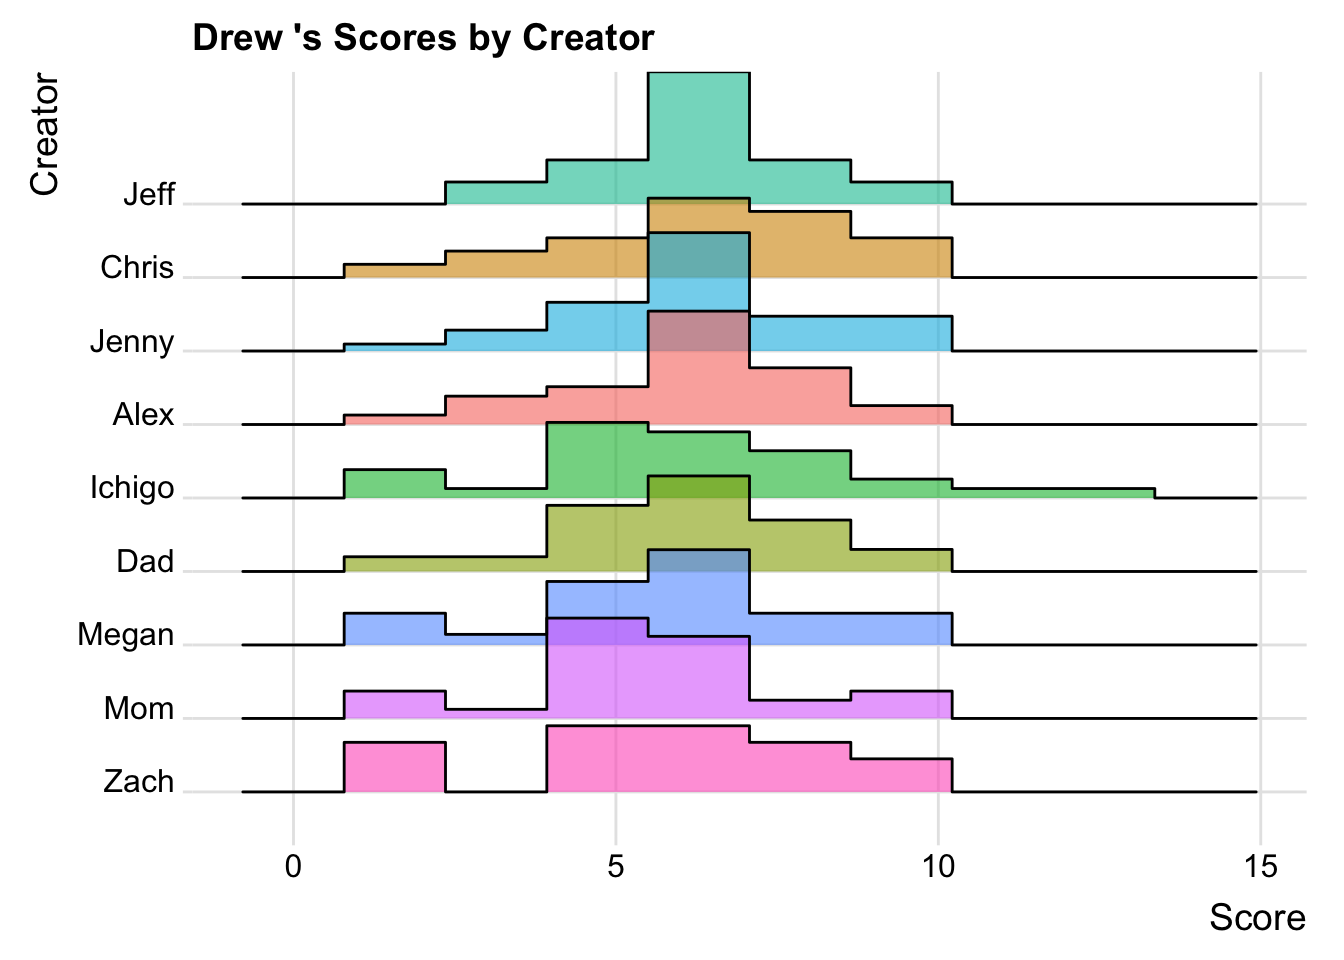
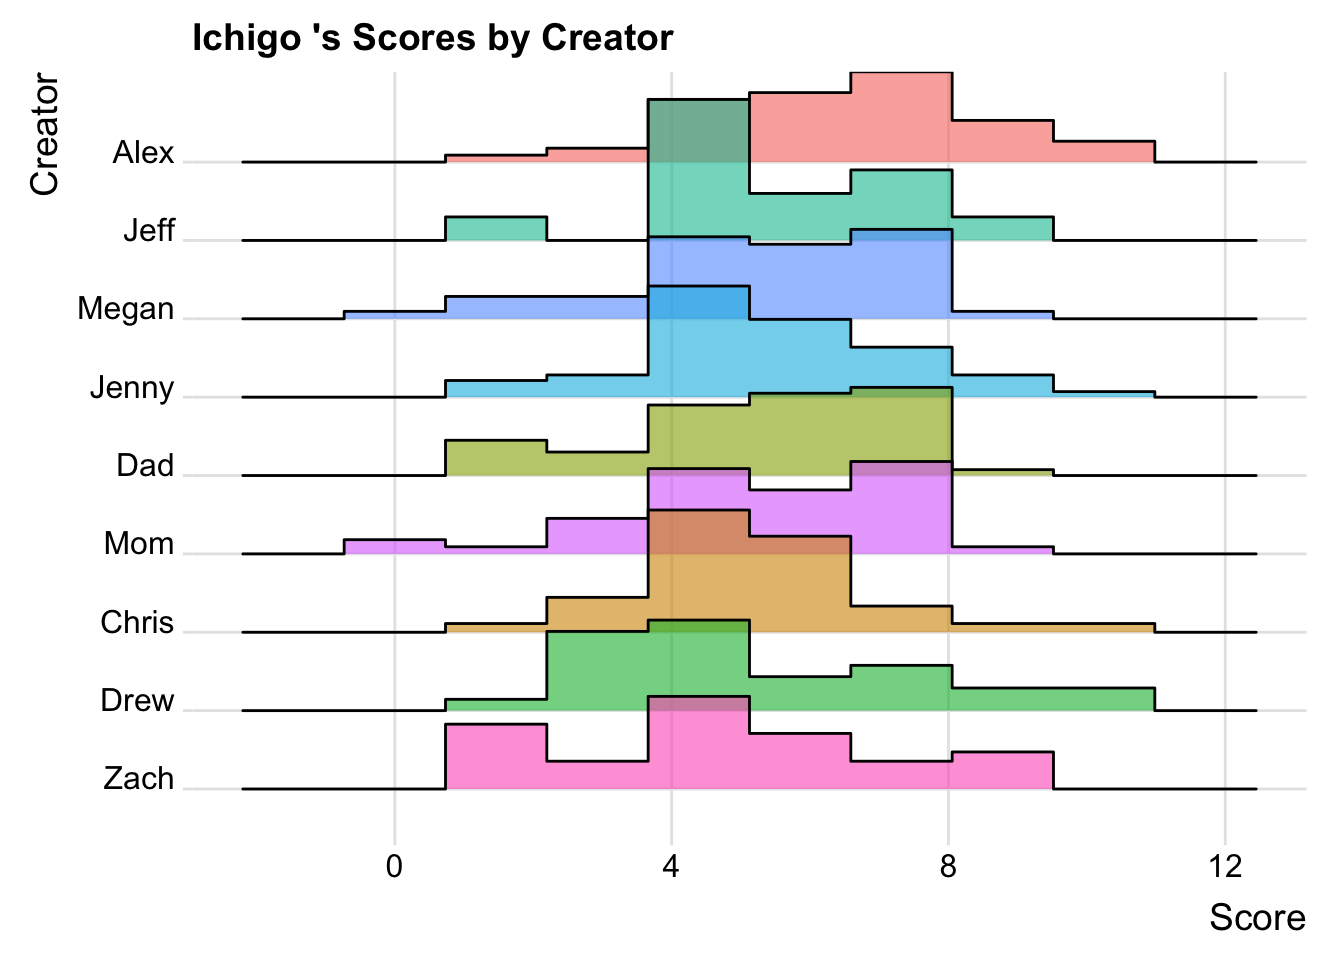
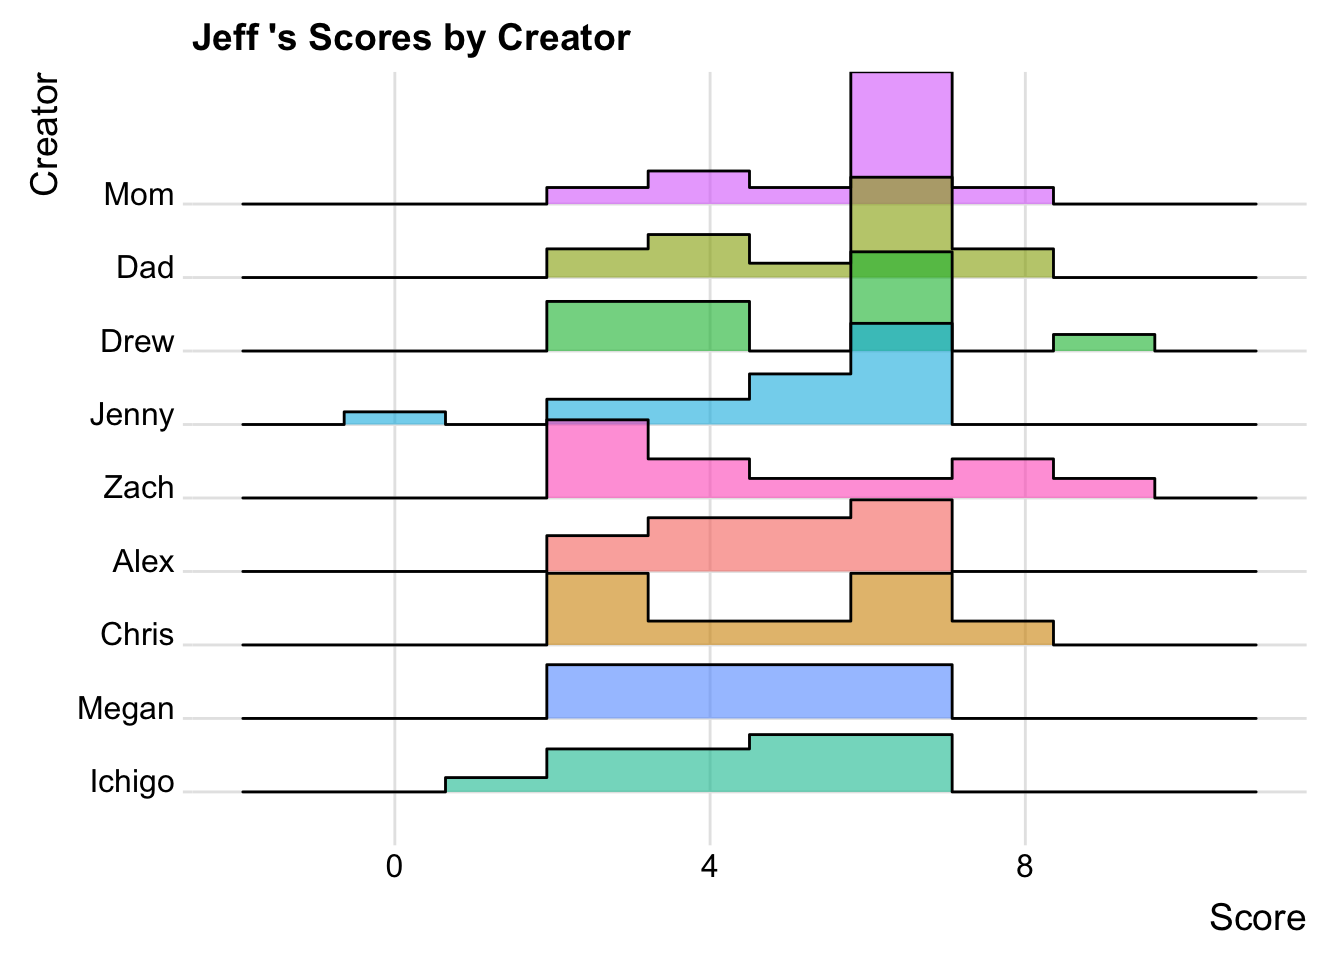
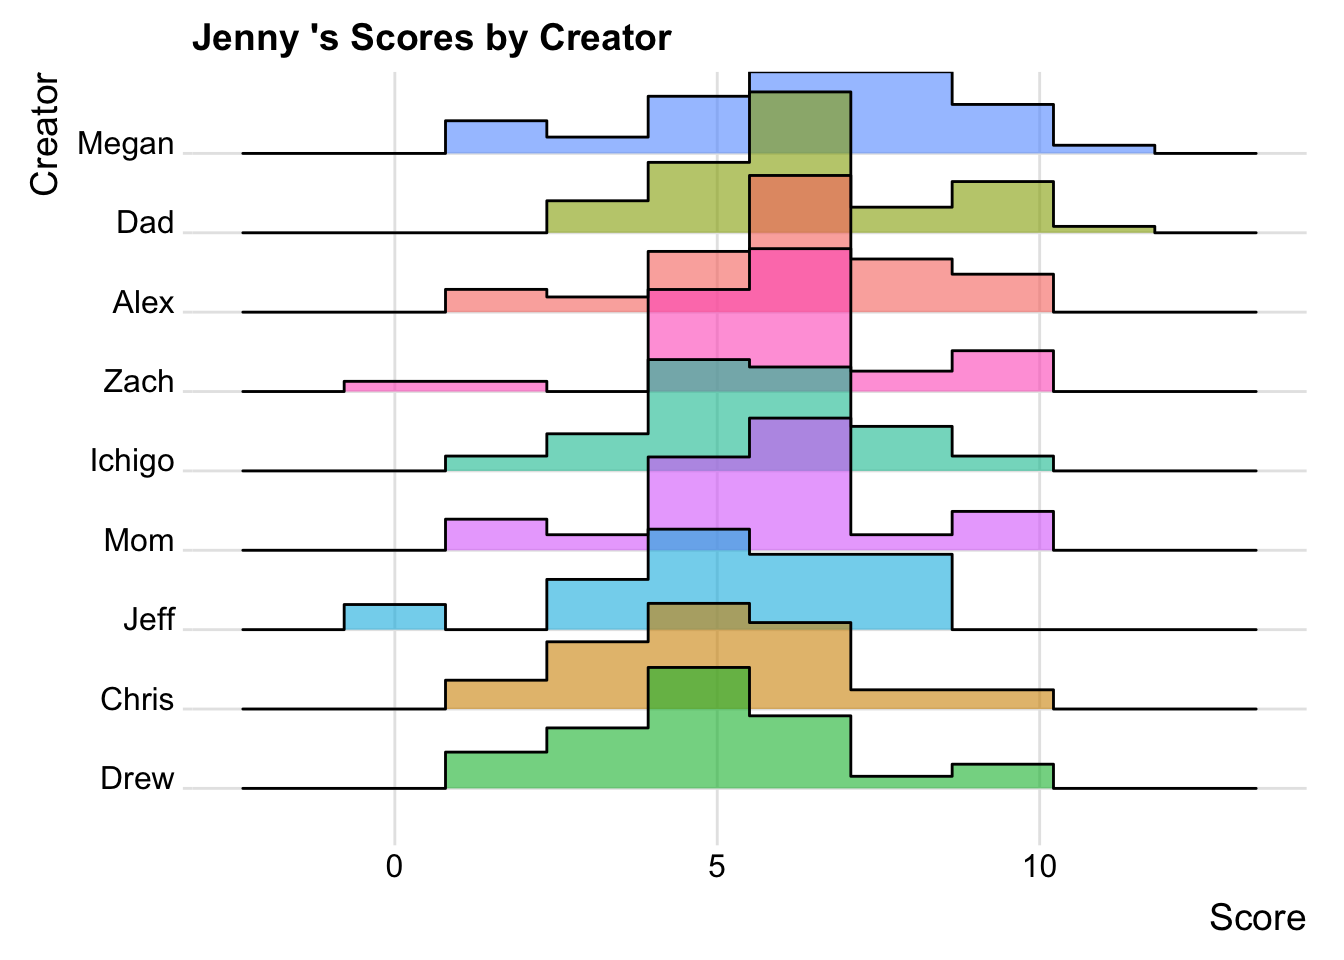
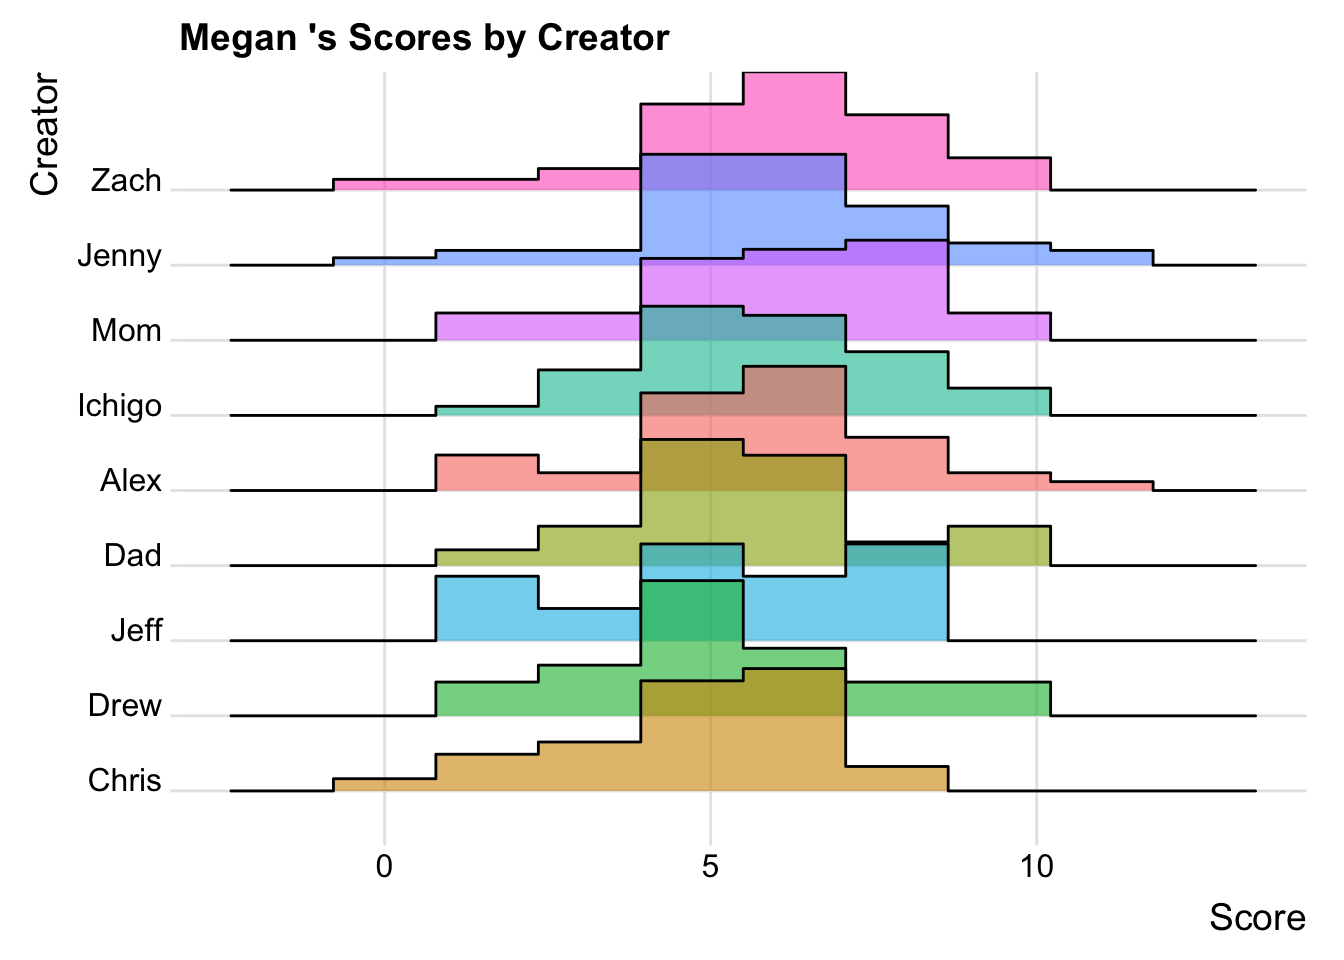
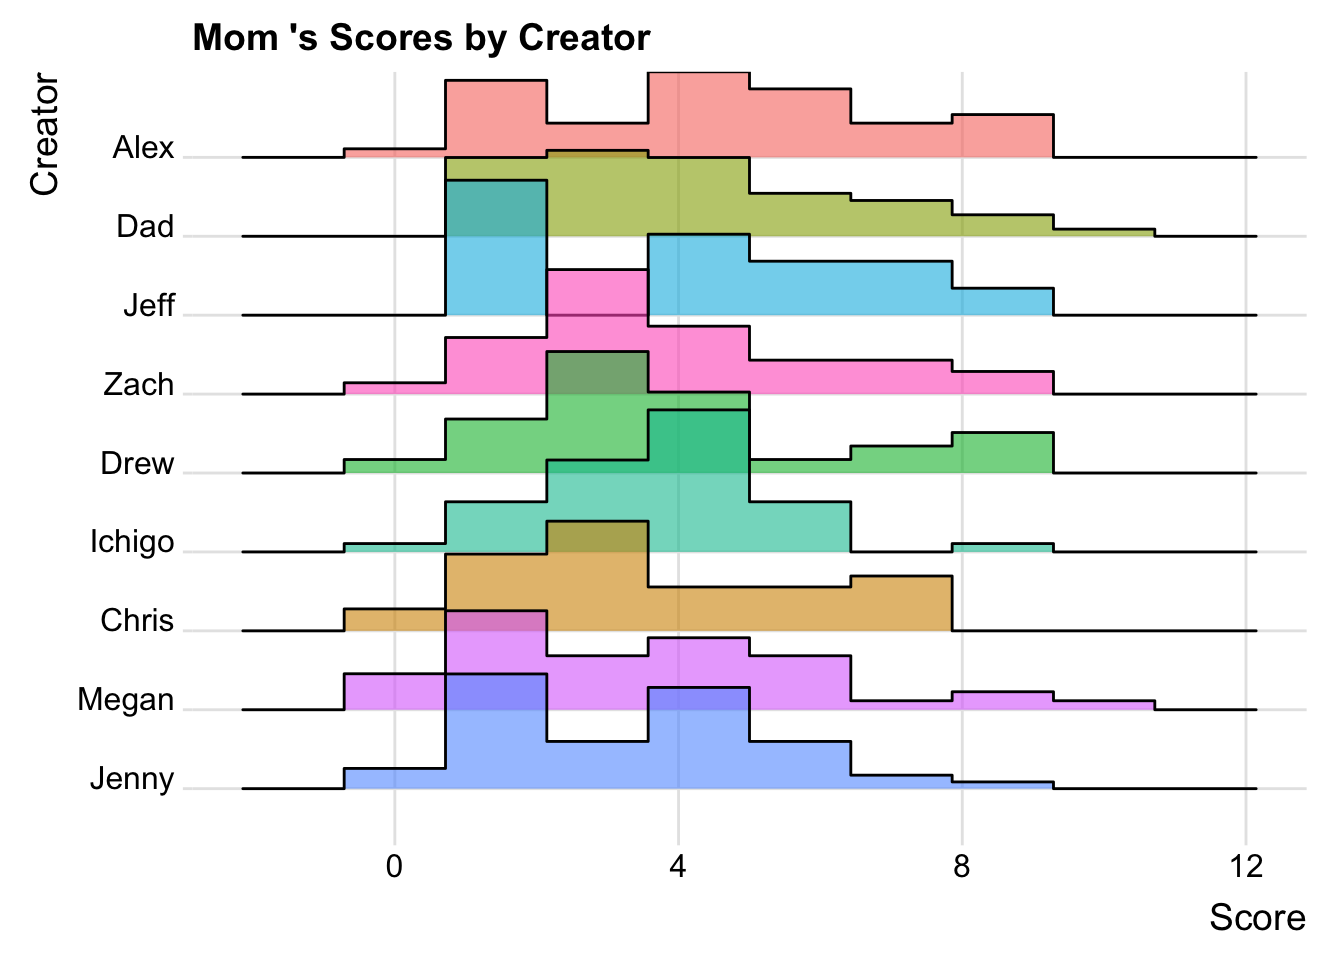
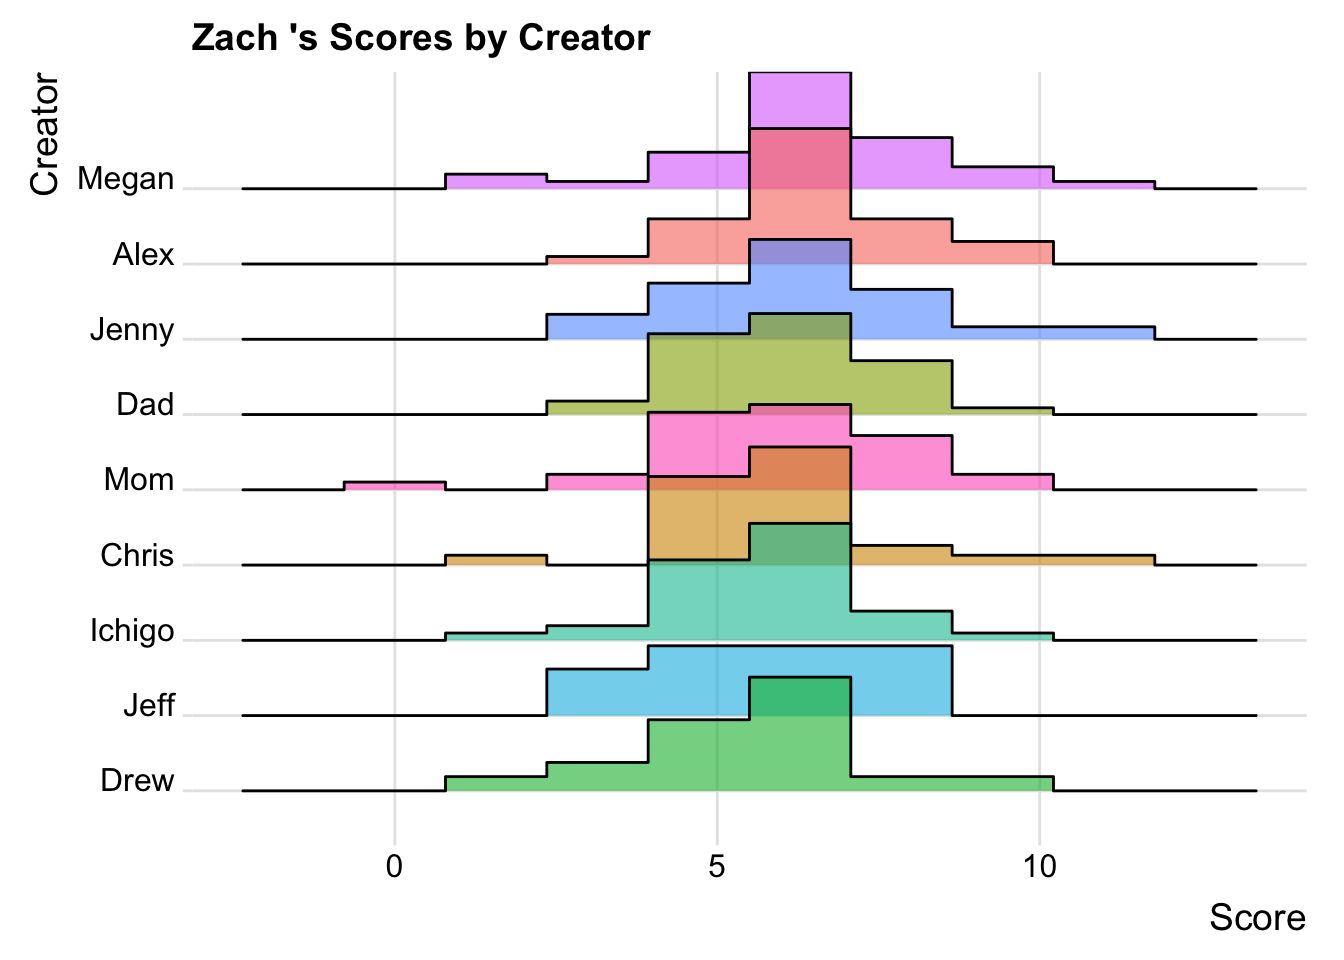
chris_coefficient_table()Full Distribution of Scores by Creator
These are the figures that were embedded directly in the original post: score distributions for each player grouped by round creator.